HN Traffic
By anders pearson •
The other day, a recent post here made it to the front page of Hacker News:

I don’t know if that still counts as a huge amount of traffic, but there was definitely a spike:
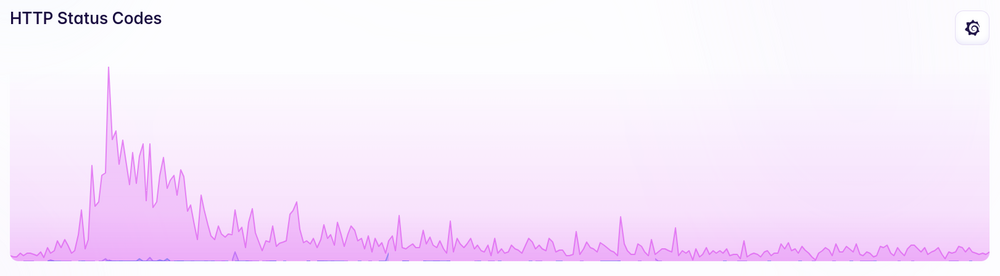
(All the graphs in here are over the same 24 hour period).
I thought it might be interesting to show how the site, built on Elixir and the Phoenix web framework with basically zero attention paid to caching, scaling, or performance beyond what Phoenix does out of the box, performs when dealing with a reasonably large amount of traffic.
I run on Fly.io, with the site on a 256MB Firecracker VM (their smallest, and still on the free tier). The PostgreSQL database is shared with a dozen other applications and also runs on a 256MB VM.
There were a couple spikes in response time, but those actually seem pretty common for the site in general and are mostly from deployments rather than changes in traffic:
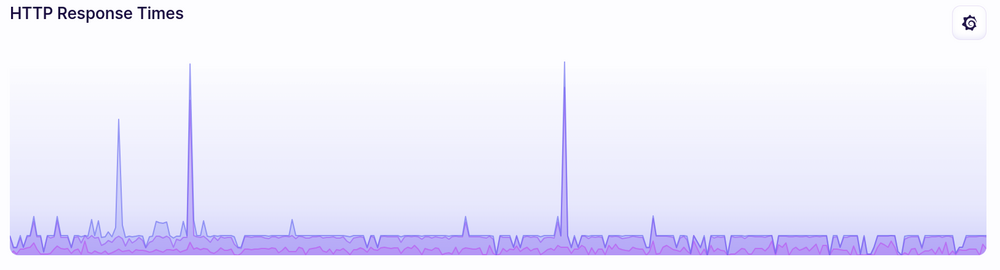
For the most part, response times didn’t really change when it was getting the HN traffic spike.
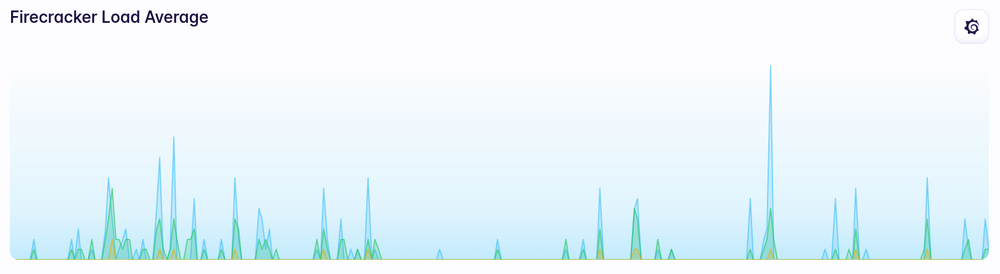
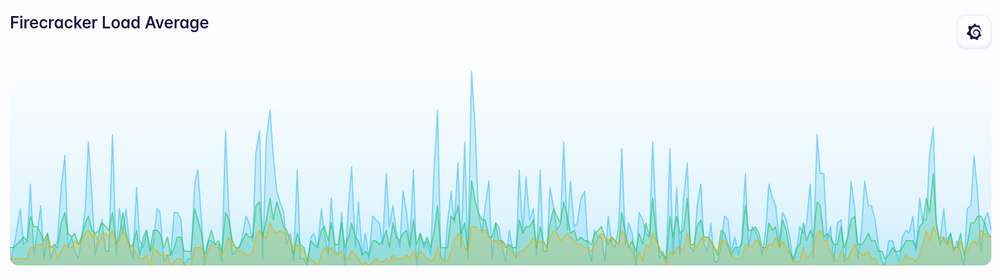
Load average doesn’t really show much of a change either:
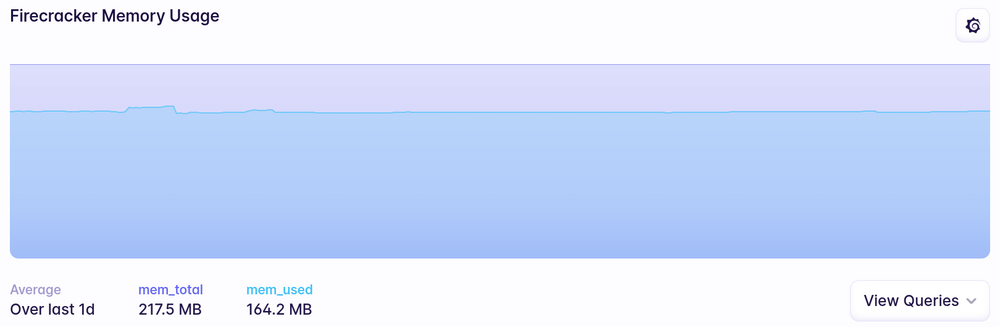
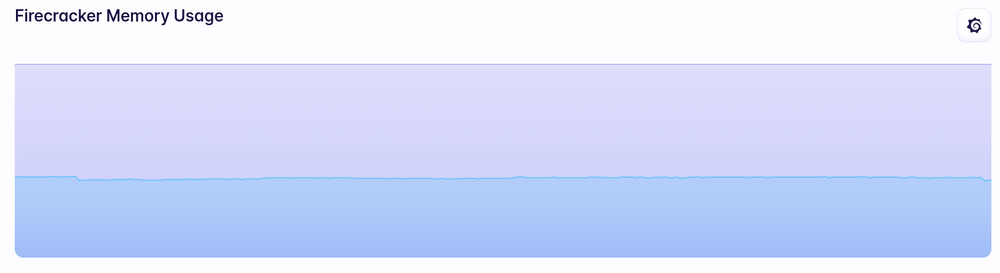
Memory usage went up slightly but never even came close to being a problem:
Fly.io spins up more VMs as needed (I’m not actually sure what load/events/whatever trigger that scaling) and it looks like maybe that happened a bit more often during the spike:

PostgreSQL handled things like a champ too. No real noticable load or memory usage over my usual baseline:
I posted a few of these in a Slack channel while it was happening and I feel like I should probably include this reaction: